

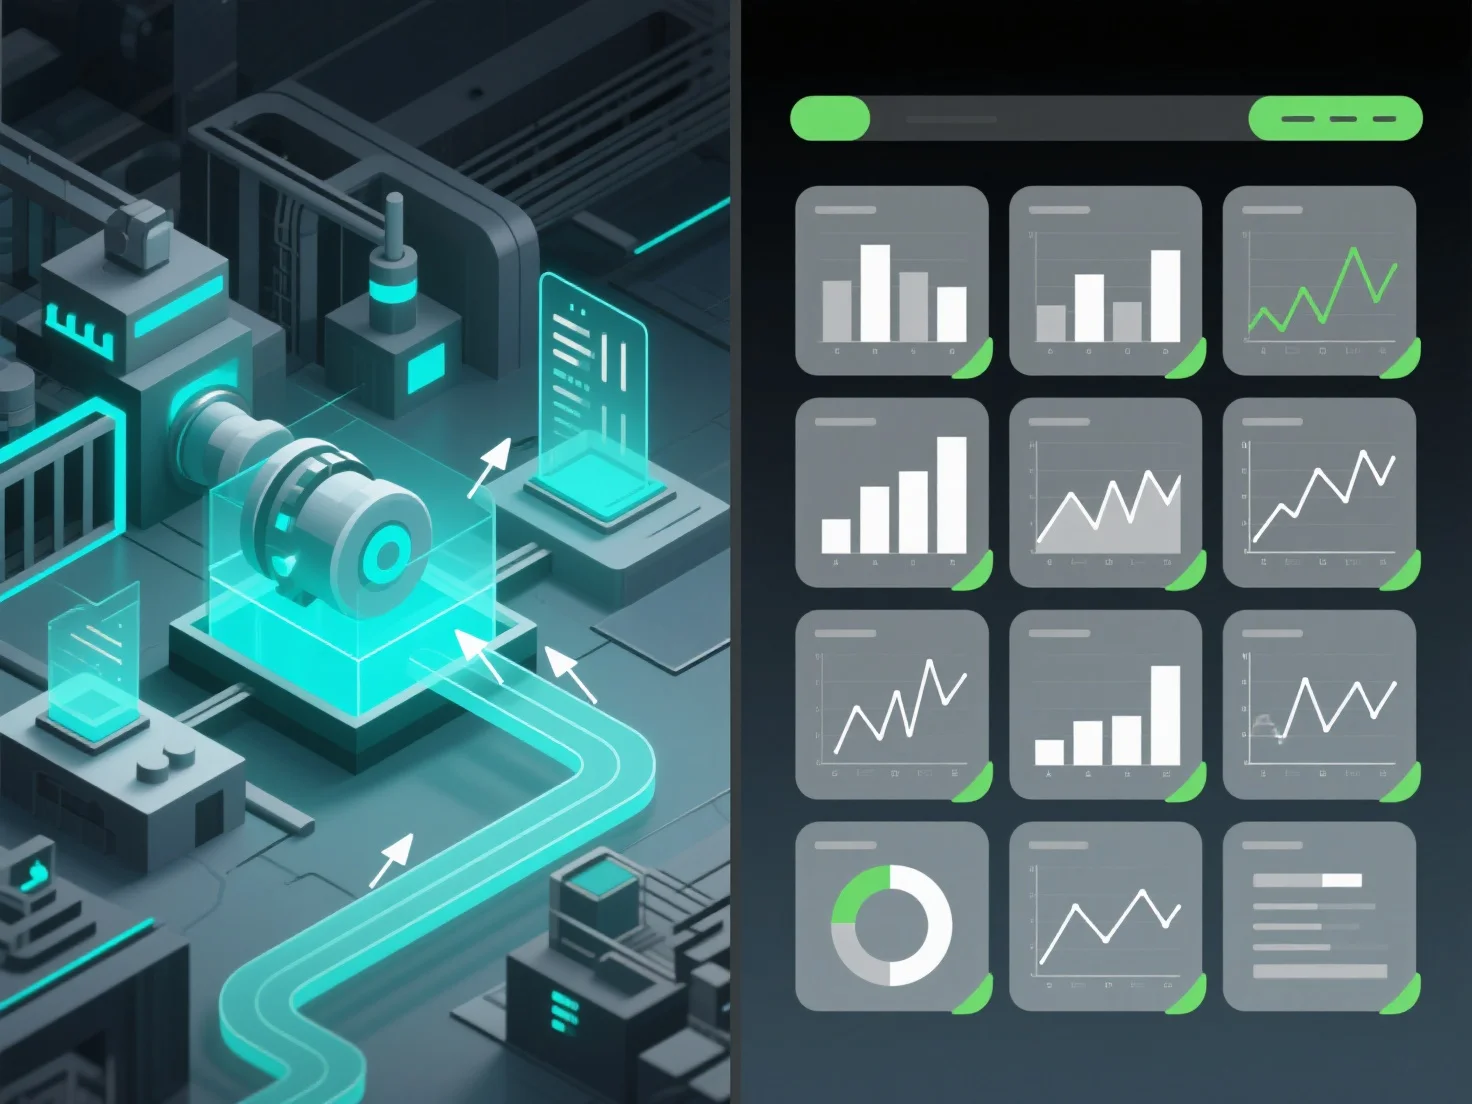
3D 디지털 트윈 시각화는 물리적 객체의 공간적, 동적, 그리고 몰입형 가상 복제를 강조하지만, 전통적인 대시보드는 차트와 메트릭을 통한 2D 정적 데이터 집계에 초점을 맞춘다.
주요 차이점은 다음과 같습니다: - **표현**: 3D 트윈은 가상의 3D 환경에서 실제 시스템을 재구성하여 공간적 맥락을 제공합니다. 대시보드는 2D 요소(표, 그래프)를 사용하여 메트릭을 요약합니다. - **상호 작용**: 3D 트윈은 실시간 시뮬레이션 및 대화식 탐색을 가능하게 합니다. 대시보드는 정적인 데이터 보기를 제공하여 메트릭을 빠르게 확인할 수 있습니다. - **사용 사례**: 제조(3D 모니터는 생산 라인의 공간적 흐름을 재현하며, 대시보드는 막대형 차트를 통해 생산량을 추적합니다), 도시계획(3D 모형은 공간 분석을 위한 인프라를 제공하며, 대시보드는 열 지도를 통해 밀도를 표시합니다).
복잡한 공간 관계나 시뮬레이션을 위해 3D 트윈을 선택하거나, 빠른 데이터 요약을 위해 대시보드를 사용하십시오.